Description of Hyperspectral Imaging
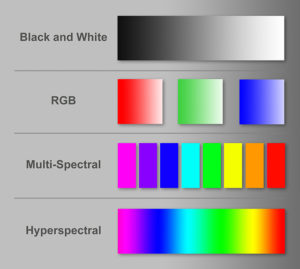
Figure 1. Different modes of imaging illustrating the benefits of hyperspectral imaging.
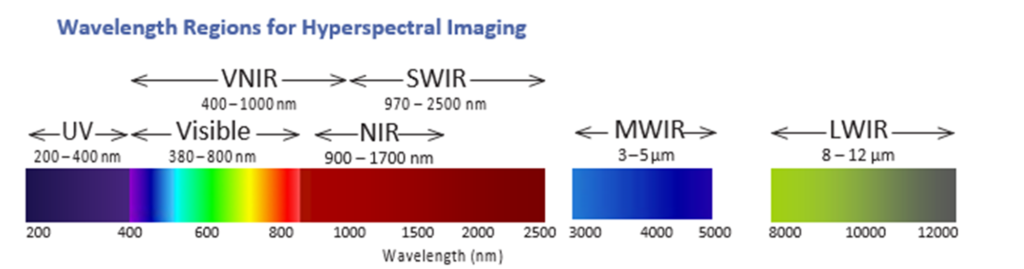
Hyperspectral imaging (HSI), or chemical imaging (CI), is the combination of spectroscopy and digital imaging. A spectral image contains many spectra, one for each individual point on the sample’s surface. The image contains valuable information about the spatial distribution of the materials within the sample. For the purposes of this webpage, we refer to hyperspectral imaging in the ultraviolet (UV) to long-wave infrared (LWIR) range, the latter of which is known as mid-infrared in general spectroscopy. Spectral information other than optical can also be referred to as hyperspectral, but is beyond the scope of this page.
From among the different wavelength ranges, near infrared (NIR) spectroscopy has been widely used for quality assurance purposes to analyze solid and liquid samples without modifying or diluting them. Measurements performed on a NIR spectrometer are rapid, require minimal or no sample preparation, and achieve a high signal-to-noise ratio. Consequently, the extension of NIR spectroscopy from a point measurement to an image containing the spectra of millions of points is useful for exploring the composition pattern of samples as they appear in manufacturing processes. This process of obtaining a NIR composition image is referred to as chemical imaging. Hyperspectral camera nomenclature on this webpage, refers to NIR as the 1000-1700 nm range, whereas short-wave infrared (SWIR) refers to 1000- 2500 nm range. In general spectroscopy, NIR usually refers to the 1000-2500 nm wavelength range. To further complicate camera vs. conventional spectroscopy nomenclature, the visible camera manufacturers refer to NIR as the extension of the wavelength range of silicon based cameras, from the visible to 1000 nm, which is called visible-near infrared (VNIR). Depending on the number of spectral bands and wavelengths measured, an image is classified as a multispectral image when several wavelengths are measured, and a hyperspectral image when a complete wavelength region, i.e., the whole spectrum, is measured for each spatial point. For example, an RGB image from a typical digital camera is a type of multispectral image that uses the light intensity at three specific wavelengths: red, green, and blue, to create an image in the visible region. Figure 1 compares the optical information obtained by monochrome cameras (which produce black and white images that only give information about the light intensity), RGB cameras, multi-spectral and hyperspectral cameras.
What would you like to know? Ask a hyperspectral imaging expert. Call now (608) 831-2141 or send us a message >
Hyperspectral Imaging Cameras
Middleton Spectral Vision specializes in applications using hyperspectral imaging, the process of measuring a complete spectrum at each spatial point of a sample with a hyperspectral camera. A hyperspectral camera is the integration of an imaging spectrograph with a monochrome matrix array sensor (camera). The basic building blocks of push-broom hyperspectral cameras are shown in Figure 2.
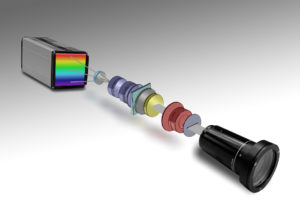
Figure 2. Hyperspectral camera schematic showing basic building blocks of push-broom hyperspectral cameras.
A special lens images the sample onto a slit of a transmission spectrograph. The spectrograph produces a spectrum imaged on a focal plane array detector, preserving the location of respective points on the slit and thus the points of the line on the sample. Successive lines on the sample measured over time form a complete hyperspectral dataset. This data from a hyperspectral camera is called a “hypercube” (Figure 3) containing information in two spatial dimensions and one spectral dimension. The hypercube is typically processed with similar hypercube measurements of a highly reflective white reference material and the residual background signal, the latter of which is measured when no light is falling on the focal plane array. The resultant corrected spectra are produced in transmittance, reflectance or absorbance similar to traditional spectroscopic measurements. The results can be further processed, scaled, smoothed, and eventually compressed to produce the information that can be used for measurements, such as composition, color coordinates or thickness. One of the significant differences between HSI and conventional single-point spectroscopy is the very large amount of data generated. Special processing software and hardware are necessary to keep up with the data stream and provide compressed and processed data, such as pinpointing contaminants, identifying defects in a process, producing composition maps and other technologically meaningful information. Fortunately, there are many computer and software options capable of handling these data sets.
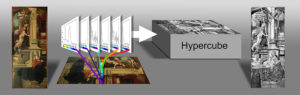
Figure 3. Illustration of a hypercube
Spectroscopy with Hyperspectral Cameras
Working with hyperspectral cameras is similar to equivalent off-line near-infrared or UV-visible spectroscopy, except that each spatial point has its own measurement. When comparing relative performance of cameras and spectrometers, the wavelength calibration, photometric linearity, and signal-to-noise must be evaluated. Spatial resolution and available optical energy for each wavelength element must be optimized for the particular application. (Kemeny, 2008).
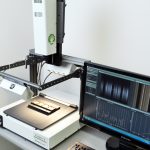
MSV 500 Spectral Camera mounted to Via-Spec™ II Scanner
From among the currently available and truly parallel hyperspectral systems, there are two basic methods for gathering the same or similar spectral information. Staring array systems image the whole sample at the same time and step through the spectral wavelengths, one wavelength at a time, normally with a tunable filter. In contrast, a push-broom camera gathers a complete spectrum of each point on one spatial line. The area of the object is then scanned one line at a time. To image the whole sample, either the sample or the camera must move. The hypercube is collected by compiling the optical data from each spatial line. This is different from the staring array method in which the camera and sample remain stationary.
Each technique has some advantages for certain applications, but both can be applied for most applications. Due to the delay in the tuning of filters and the more efficient optical system of push-broom cameras, the push-broom system has better overall throughput (Hyvarinen, 2008). Push-broom imaging works much better in monitoring industrial processes where the materials are usually moving at a constant speed. In airborne applications, the steady movement of the aircraft provides the constant scanning of the ground surface, thus push-broom cameras can be used effectively in those applications as well.
Look through our Project Examples and Applications for deeper information.
Then tell us about you. Call (608) 831-2141 or send us a message about your application >
Push-broom cameras have either transmission or reflective gratings to distribute the light according to wavelength. Transmission gratings have high throughput, less distortion, and do not produce polarization artifacts. The push-broom method is better suited than the staring array method for imaging large streams of on-line samples typical in many production facilities. The approach of measuring all spectra of the line at the same instance assures that all the wavelength information is truly measured from the same portion of the sample, even though the sample is moving during measurement. This condition is different with staring array cameras.
When the intensity from different wavelengths is measured at different times, the data in the hypercube does not correlate with the same sample point, thus staring array HSI cameras can only be used if the sample can be considered stationary. When measuring a sample using staring array imaging, a light source must illuminate the whole sample for the duration of the measurement. In contrast, since push-broom imaging detects one line at a time, line illumination can be used so that the whole sample is not under direct heat from the illumination during the entire measurement. The line of the sample is only illuminated for a fraction of a second during the measurement.
Hyperspectral imaging can be used for different sample sizes, from scanning a mile-wide swath of agricultural land to detecting microscopic cell organelles. For different magnifications, the same cameras can be used by replacing the fore optics in the system. Middleton Spectral Vision offers a wide variety of cameras and integrated systems for hyperpspectral applications. Contact us to discuss your application requirements.
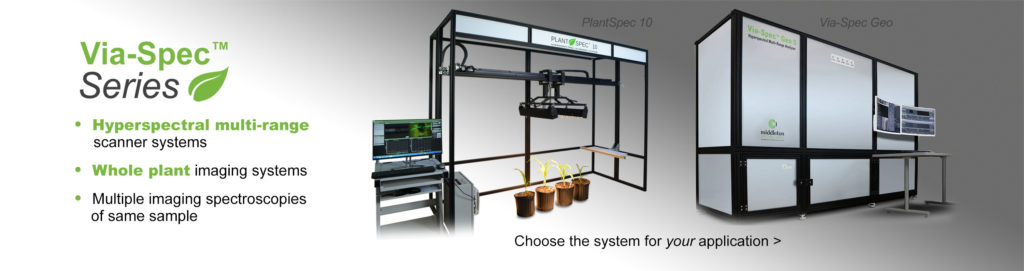
Hyperspectral Imaging Systems for Pure Component Identification, Acquiring spectra over a broad wavelength range, with Spectral Information in Every Pixel